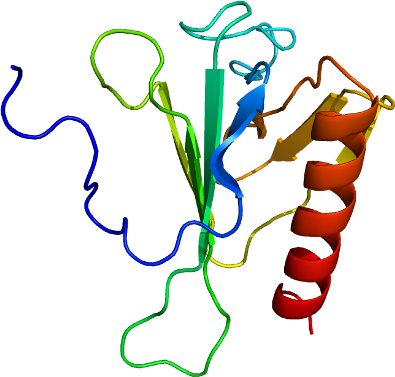
SPRED2
PDB:2JP2
Revision
Revision Type:created
Revised by:created
Revision Date:created
Entry Clone Accession:gi|32401445
Entry Clone Source:SGC Clone Accession:Tag:Host:E. coli BL21(DE3)-R3
Construct
Prelude:Sequence:gsMTEETHPDDDSYIVRVKAVVMTRDDSS GGWFPQEGGGISRVGVCKVMHPEGNGRSG FLIHGERQKDKLVVLECYVRKDLVYTKAN PTFHHWKVDNRKFGLTFQSPADARAFDRG VRKAIEDLIE
Vector:pGEX-4T-2 (Pharmacia)
Growth
Medium:Antibiotics:Procedure:The domain was expressed as glutathione S-transferase (GST)-fusion protein, grown in BL21(DE3) cells at 37°C for 3 hrs. The cells were induced at an OD600nm value of 0.5-1.0 using 1 mM isopropyl b-D-thiogalactopyranoside (IPTG) and incubated at 37°C for a further 4 h before harvesting. Expression was analyzed by SDS-PAGE. Uniformly
15N- and
13C,
15N-labelled samples of the Spred2 EVH1 domain were prepared by growing cells either in a MOPS minimal medium containing 9.5 mM
15NH4Cl or in
13C,
15N-labelled complete medium E. coli OD CN (Silantes, Munich).
Starter overnight cultures of 50?100 ml were grown at 37°C in either MOPS minimal medium containing 9.5 mM
15NH_4 Cl or in
13C,
15N-labelled complete medium E. coli OD CN (Silantes, Munich) supplemented with 100 µg/ml carbenicillin. The large scale cultures were grown in 4 x 500 ml of the respective medium with 100 µg/ml ampicillin in 4 x 2 L bottles containing indentations for good aeration of the cells (dilution for inoculation 1:50 to 1:100). The culture was grown at 37°C to an OD 600nm value of 0.5-1.0. The culture was induced with 1 mM IPTG and grown at 37°C for further 4 h. Cells were harvested by centrifugation and frozen at -20°C.
Purification
ProcedureColumn 1:GSH-Sepharose 4B (Amersham/Pharmacia) equilibrated in phosphate-buffered (pH 7.2 ) saline (PBS)
Column 2: 120 ml Superdex 75 (Pharmacia) equilibrated with 20 mM NaPi (pH 6.3), 2 mM EGTA.
The cell lysate was adsorbed to the GSH-Sepharose 4B matrix. The column was washed with 5 column volumes each of buffer B1, buffer B2 followed by a final PBS wash and eluted with 50 mM Tris HCl buffer pH 8.5, 50 mM GSH (pH 7.5) at a flow rate of 2 ml/min. Protein-containing fractions were analyzed by SDS-PAGE, pooled and concentrated with exchange of buffer to PBS, 2 mM DTT using Centricon 10 cartridges (Amicon).
Thrombin-cleavage: The GST-tag was cleaved at a concentration of ~ 20 mg/ml with 5 U thrombin (Amersham) per mg fusion protein by incubation at 30°C overnight .
The flow through was collected and concentrated. Gelfiltration was performed at a flow rate of 0.5 ml/min and extinction at 280 nm recorded. Peak fractions were analysed by SDS PAGE, pooled and concentrated with buffer exchange using Centricon 10 cartridges (Amicon).
Concentration and buffer exchange: Using Amicon Centricon-10 concentrators with 10 kDa cutoff, SPRED2A-c001 was exchanged into NMR buffer (20 mM phosphate buffer pH 6.0, 50 mM NaCl, 1mM dDTT, with 0.02% sodium azide) and concentrated as follows: U-[15N]-labelled SPRED2A: final 1 mM protein in NMR buffer. U-[13C,15N]- labelled SPRED2A : protein concentration 1 mM in NMR buffer. Samples in D2O were prepared by lyophilization and redissolving into 100% D2O. Protein sample concentrations were determined from the absorbance at 280 nm.
Extraction
ProcedureFrozen cell pellets from 0.9 L culture (ca. 2.5 g wet mass) were resuspended in a total volume of 25 ml ice-cold lysis buffer 1 containing 10 mg/ml of lysozyme and incubated for 40 min on ice. After dilution with 35 ml of lysis buffer 2 containing 2 mM DTT, 10 µg/ml RNase, 5 µg/ml DNase, incubation on ice was extended for further 10 min. Cells were then lysed by sonication and the desired protein purified on a glutathione Sepharose 4B column. The GST moiety was cleaved using thrombin protease (Pharmacia), and after thrombin inactivation, separated from the protein by a further chromatographic step using glutathione Sepharose 4B, followed by gel filtration on a 120 ml Superdex 75 column (Pharmacia).
Concentration:1 mM protein in NMR buffer.
LigandMassSpec:Calculated mass of the construct was 14193 (without isotope labelling), 14375 Da with 100% 15N labelling, and 14994 Da with 100%
13C,
15N double labelling. These were confirmed by mass spectrometry carried out on each of the samples.
Crystallization:NMR Spectroscopy:NMR spectra were acquired at 300 K, using Bruker DRX 600 and DMX 750 spectrometers in standard configuration with triple resonance probes equipped with self-shielded triple axis gradient coils. Spectra for the resonance and NOE assignment were recorded essentially as described in the original references. A 1 mM
15N-labelled sample in 90% H2O/10% D2O (NMR buffer; pH 6.0) was used for 3D 15 N-separated NOESY-HSQC,
15N T1 and
15N T2 relaxation, and heteronuclear 15N-1H NOE experiments. A 1 mM
13C,
15N-labelled sample of in 90% H2O/10% D2O (NMR buffer; pH 6.0) was used for all HN-detected triple resonance experiments, 3D CBCA(CO)NNH, CBCANNH, CC(CO)NNH, H(CCCO)NNH, HBHA(CBCACO)NNH, HNCO, HN(CA)CO, and for a 3D 13C-separated, aliphatic-centred NOESY-HSQC spectrum. The sample was then freeze-dried and re-dissolved in 100% D2O for acquisition of 3D 13C-separated HMQC-NOESY, HCCH-COSY, HCCH-TOCSY and 2D NOESY and TOCSY spectra. Data were processed using the program XWIN-NMR (version 2.6) of Bruker BioSpin GmbH ( Rheinstetten , Germany ).
Data Collection:Data Processing:Assignment: Assignment of
13C,
15N and 1H resonances was carried out using standard assignment procedures on Silicon Graphics O2 workstations and an Intel Dual Xeon 3GHz PC, with the interactive program ANSIG version 3.3 ( available via anonymous ftp from ftp/) . The assignments are deposited in the BioMagResBank (
http://www.bmrb.wisc.edu/) under accession code BMRB-15216.
Assigned
15N-HSQC spectrum of the human Spred2 EVH1 domain (residues 1-124) recorded at 300 K and 600 MHz.
Structure Calculation: Preliminary three dimensional structures were calculated using the program CYANA v. 2.0 ( üntert et al., (1997) J. Mol. Biol. 273 , 283-298; Herrmann et al., (2002). J. Mol. Biol. 319 , 209-227 ) and were based on the resonance assignments together with NOE peak lists from 13C HMQC-NOESY, 3D 13C-aliphatic-centred NOESY-HSQC , 3D
13C-aromatic-centred NOESY-HSQC, and 3D
15N NOESY-HSQC spectra. These were then refined in ARIA (Linge et al., Bioinformatics 19 (2003) 315-316 ). Dihedral angle restraints were measured experimentally from J-modulated [N-H]-COSY experiments and also predicted from the chemical shift data using the program TALOS (Cornilescu et al., J. Biomol. NMR, 13 (1999) 289-302;
http://spin.niddk.nih.gov/NMRPipe/talos/ ). Once a precise ensemble of structures was obtained from these data, hydrogen bond restraints were then added on the basis of the experimentally observed protected amides. Further structure refinement was then carried out manually using XPLOR-NIH v. 2.14 ( Schwieters et al., (2003) J. Magn. Reson. 160 , 66-74;
http://nmr.cit.nih.gov/xplor-nih/ ) with refinement in explicit water in CNS ( Linge et al (2003) Proteins, 50:496-506). Structures validation was performed using the Protein Structure Validation Suite (PSVS)
http://www-nmr.cabm.rutgers.edu/PSVS and WhatCheck
http://swift.cmbi.kun.nl/WIWWWI . The refined ensemble of the 20 lowest energy structures with no NOE violations was deposited in the PDB under code 2JP2, together with the NMR restraints used for the structure calculations.